
Illustrative Research Exhibit — Simulated Data
Market Entry & Competitive Dynamics
- Research Context
- An industrial equipment business compares four synthetic market segments before allocating entry capital. The assessment combines demand pathways, incumbent capacity and entry conditions.
- Assessment Scope
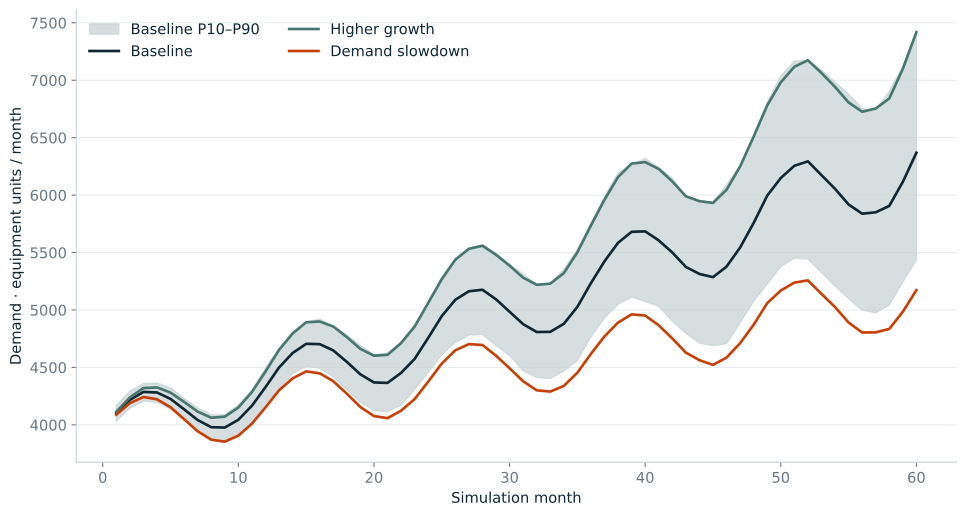
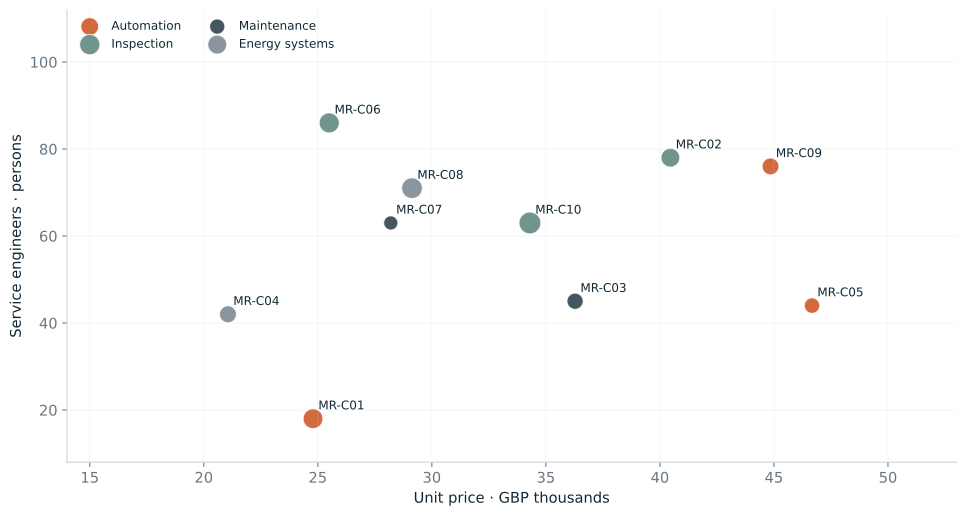
- 60 monthly periods; four segments; ten synthetic competitors; 600 simulations in each of three scenarios. No observed market evidence or causal estimation is used.
MR-01
Demand Projection & Simulation Intervals
Scroll horizontally to inspect the complete figure.
MR-02
Competitive Positioning Map
Scroll horizontally to inspect the complete figure.
MR-03
Market Attractiveness Matrix
Scroll horizontally to inspect the complete figure.
MR-04
Opportunity Ranking Sensitivity
Scroll horizontally to inspect the complete figure.
Principal Findings
- The baseline month-60 demand median is 6,369 units/month, with a 5,434–7,435 simulated percentile band. This range is generated by declared parameter distributions.
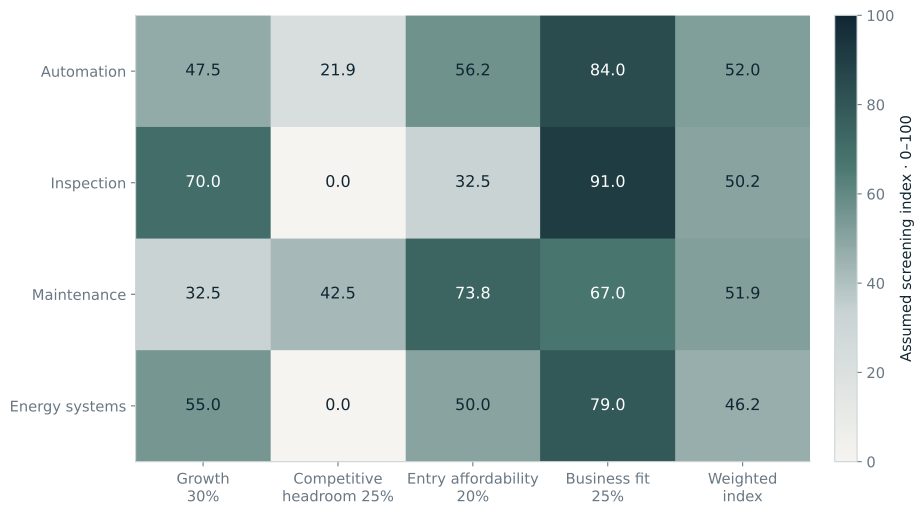
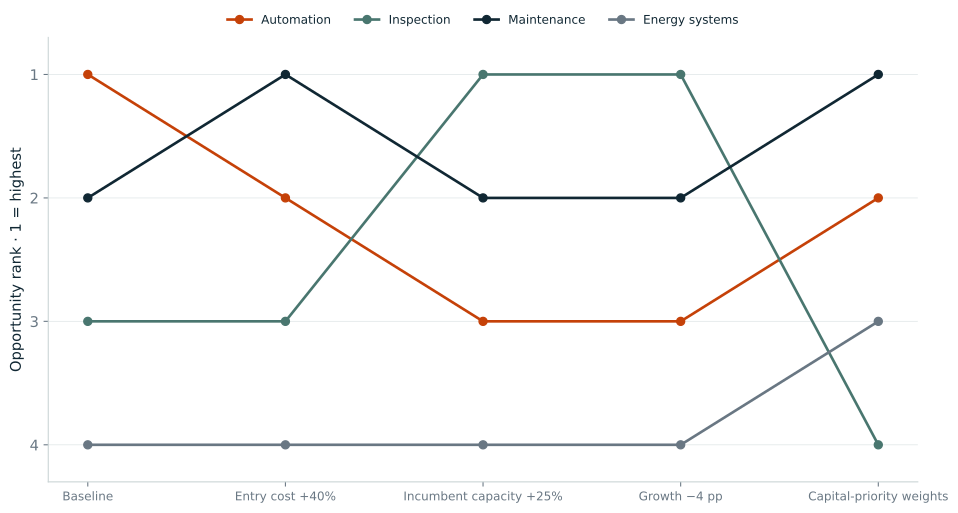
- The nominal baseline leader is Automation (52.0/100), only 0.09 points above the runner-up. The capital-priority case instead ranks maintenance first (63.9/100), demonstrating dependence on explicit decision weights.
Executive Interpretation
Automation and maintenance are nearly tied under baseline weights (52.0 and 51.9). Maintenance ranks first when entry affordability receives greater weight. The small baseline difference does not establish a robust preference. Capital allocation should remain conditional on verified segment demand, incumbent capacity and entry-cost evidence; the simulated ranking is a prioritisation framework, not a market forecast.
Decision Conditions
- Confirm segment demand and entry costs before approving capital. Replace assumed growth, incumbent capacity and business-fit inputs with independently reviewed evidence.
- Treat the weighted index as a screening preference. Capital-priority weights are 10% growth, 15% headroom, 60% entry affordability and 15% fit; baseline weights are stated beside the matrix.
Evidence Limitations
- All entities, prices, demand, capacity and suitability values are simulated. No scenario probability is estimated.
- Capacity relative to demand is only an assumed competitive-exposure proxy. It excludes product differentiation, competitor responses and observed purchase behaviour.