04Strategic Research

More than one future is possible.

Every important business decision involves a view of the future. But markets, competitors and operating conditions keep changing. A choice that makes sense today may not hold up under every set of conditions.

What We Help You Understand

We examine market changes, operating data, competitive behaviour, cost structures and the relationships between key variables. This helps clients understand how different factors affect business results and compare the opportunities, costs and risks of alternative actions across a range of scenarios.

Where It Matters

When businesses adjust their strategy, enter a new field or respond to changing costs and demand, we aim to clarify the conditions that matter most to the outcome. Our purpose is to help them recognise early signals of change and develop plans that can adapt as circumstances evolve.

SR-001

Research Exhibits

Modelled scenarios, structured evidence and conditional assessments.

Illustrative Research Exhibit — Simulated Data

Capacity Expansion Under Uncertainty

Research Context
A simulated regional retailer compares retained capacity, phased expansion and full expansion over 36 months. The question is whether added fulfilment capacity justifies its cash commitment when demand growth and commissioning conditions vary.
Assessment Scope
Four-stock Vensim model executed by PySD; 12 scenario/option trajectories, 200 common Monte Carlo draws across three options, and 144 sensitivity conditions. All parameters and results are illustrative, with no empirical calibration.
SR-01

System Dynamics Structure
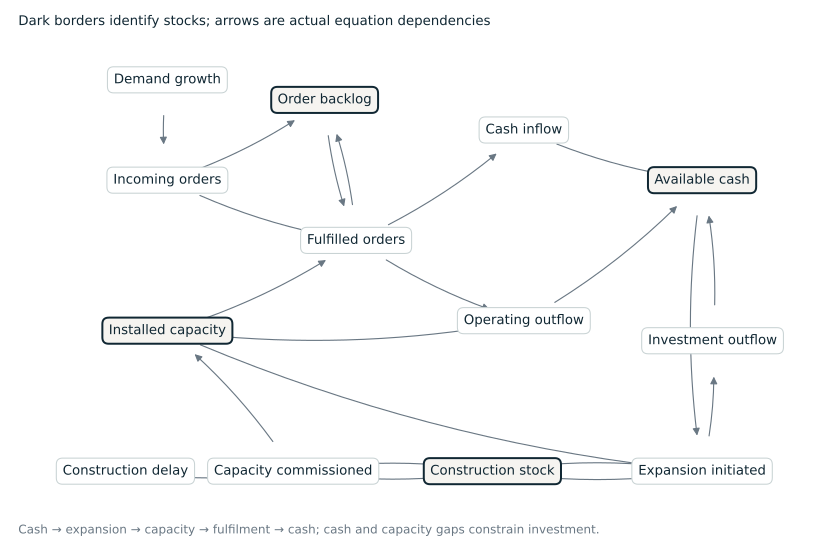
System Dynamics Structure. Selected operational dependencies extracted from the executed PySD equations. Four stocks and cash–capacity feedback are shown; all equations and excluded parameter links remain in the source model.

Scroll horizontally to inspect the complete figure.

Selected operational dependencies extracted from the executed PySD equations. Four stocks and cash–capacity feedback are shown; all equations and excluded parameter links remain in the source model.
Open full-size figure Chart data
SR-02

Scenario Trajectories

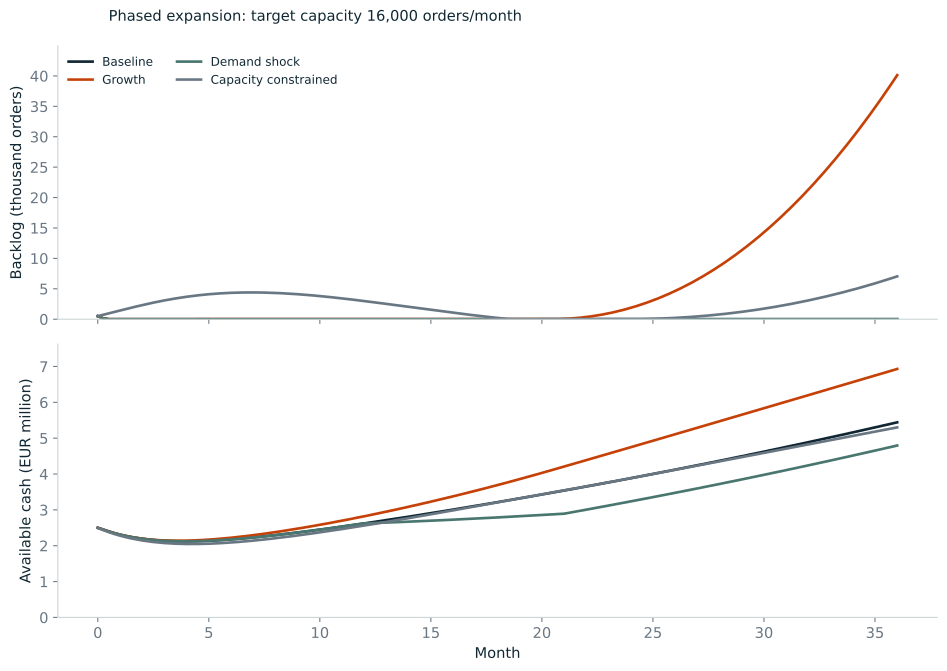
Scenario Trajectories. Four 36-month scenarios under the phased expansion option. Capacity under construction converts through a six-month first-order delay; the full dataset retains all three options.

Scroll horizontally to inspect the complete figure.

Four 36-month scenarios under the phased expansion option. Capacity under construction converts through a six-month first-order delay; the full dataset retains all three options.
Open full-size figure Chart data
SR-03

Monte Carlo Outcome Distribution
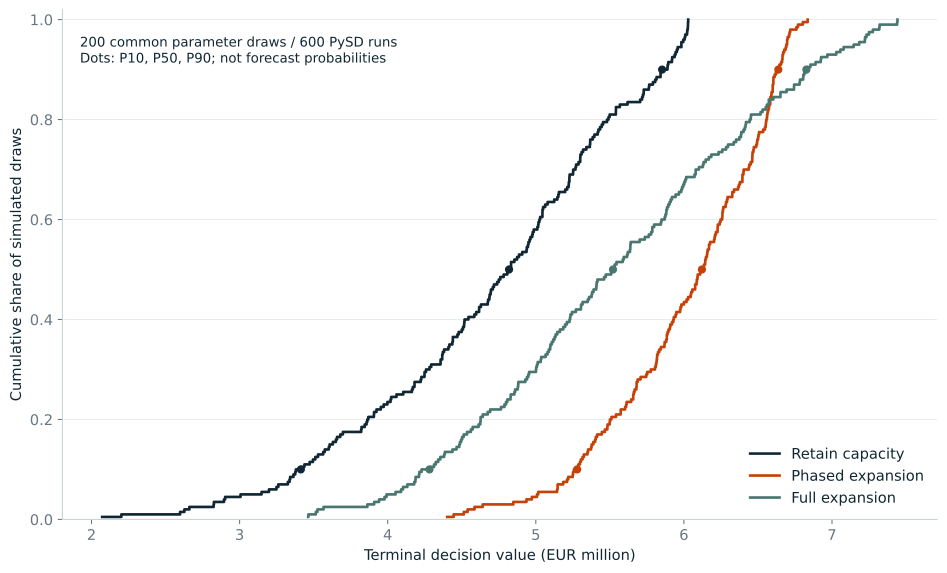
Monte Carlo Outcome Distribution. Empirical cumulative distributions from 200 independent assumption draws applied to each option. Growth, capital cost and commissioning delay use declared triangular distributions; shocks use Bernoulli and uniform draws. The decision value includes assumed residual capacity value and backlog liability.

Scroll horizontally to inspect the complete figure.

Empirical cumulative distributions from 200 independent assumption draws applied to each option. Growth, capital cost and commissioning delay use declared triangular distributions; shocks use Bernoulli and uniform draws. The decision value includes assumed residual capacity value and backlog liability.
Open full-size figure Chart data
SR-04

Sensitivity & Decision Conditions
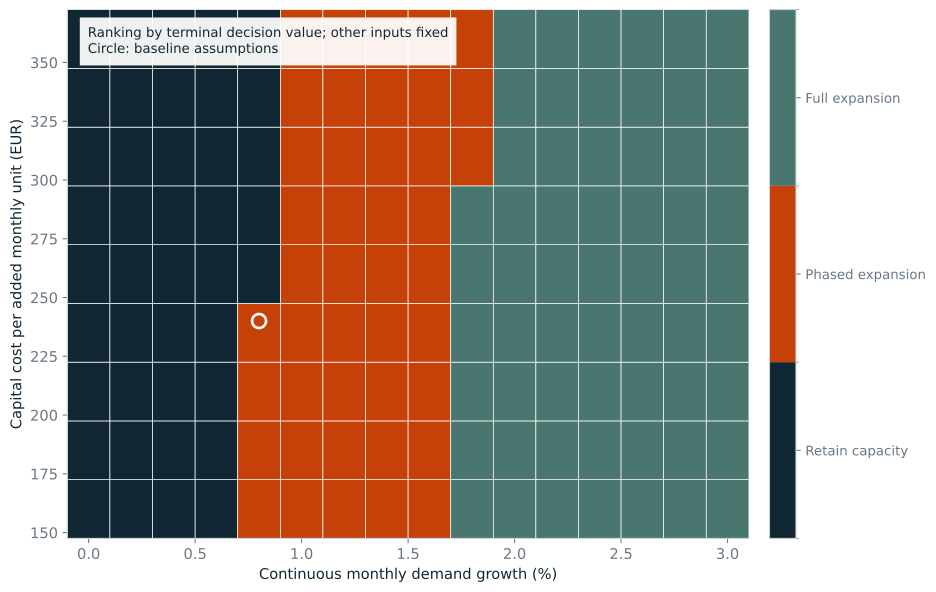
Sensitivity & Decision Conditions. Preferred option on a 16 × 9 growth/capital-cost grid, ranked by the declared terminal decision value. The boundary is conditional on residual value, backlog liability and the fixed six-month commissioning delay; it is not a probability forecast.

Scroll horizontally to inspect the complete figure.

Preferred option on a 16 × 9 growth/capital-cost grid, ranked by the declared terminal decision value. The boundary is conditional on residual value, backlog liability and the fixed six-month commissioning delay; it is not a probability forecast.
Open full-size figure Chart data

Principal Findings

  1. Under the baseline, phased expansion ends with EUR 5.44m cash and 0 queued orders; retained capacity ends with EUR 6.25m cash but 18,604 queued orders.
  2. At 2.0% continuous monthly growth, full expansion reduces terminal backlog to 372 orders versus 125,502 under retained capacity and becomes preferred under the stated decision measure.
  3. In the 200 common simulated parameter draws, retained, phased and full capacity rank first 35, 116 and 49 times. These counts describe the chosen assumption distribution, not real-world probabilities.
Scenario Assessment & Conditional Outcomes
OptionBaseline cash (EUR m)Baseline backlog (orders)MC decision value P10 / P50 / P90 (EUR m)First-ranked draws
Retain capacity6.2518,6043.41 / 4.82 / 5.8535/200
Phased expansion5.4405.28 / 6.12 / 6.64116/200
Full expansion3.9804.28 / 5.52 / 6.8349/200

Executive Interpretation

The baseline favours phased expansion under the declared terminal-value measure, although retained capacity preserves more cash. Stronger demand changes the preference to full expansion as backlog costs rise. The ranking therefore depends on demand growth, capital cost and commissioning delay, together with assumed residual value and backlog liability; these inputs require business validation before investment approval.

Decision Conditions

  • At EUR 235 per added monthly unit, the sampled monthly-growth grid favours retain capacity at 0.0–0.6%; phased expansion at 0.8–1.6%; full expansion at 1.8–3.0%. These are conditional comparisons; thresholds between sampled values are not resolved.
  • Validate attainable throughput, the first-order commissioning assumption, cash collection timing, backlog liabilities and residual asset value before applying the model. The EUR 600,000 reserve constrains new investment but does not guarantee a universal cash floor.

Evidence Limitations

  • Synthetic demand and independent parameter distributions have no empirical calibration. The simulation intervals and scenario frequencies are not forecasts.
  • The objective is terminal cash plus 40% residual expansion value minus EUR 25 per queued order. It is not discounted cash flow; cancellation, financing, tax and receivables delays are excluded.
  • Capacity commissions gradually through a first-order delay. Liquidity remains positive in the tested range; cash-distress and fixed completion-date models are outside scope.

Illustrative Research Exhibit — Simulated Data

The data and scenarios are simulated. They do not represent a real client engagement or verified market facts.

Scroll horizontally to inspect the complete figure.

Illustrative Research Exhibit — Simulated Data

Open full-size figure

Our Perspective

We do not seek to remove uncertainty about the future. We aim to help clients be better prepared for every important decision.

Discuss your project

Discuss your options and the conditions that matter.

Outline the actions you are weighing and the changes affecting your decision. We can discuss the variables, constraints and conditions for adapting your plans.